
Accountability and Transparency in Government
Citizen's Guide to Finances: Pension Liability
Pension Plan
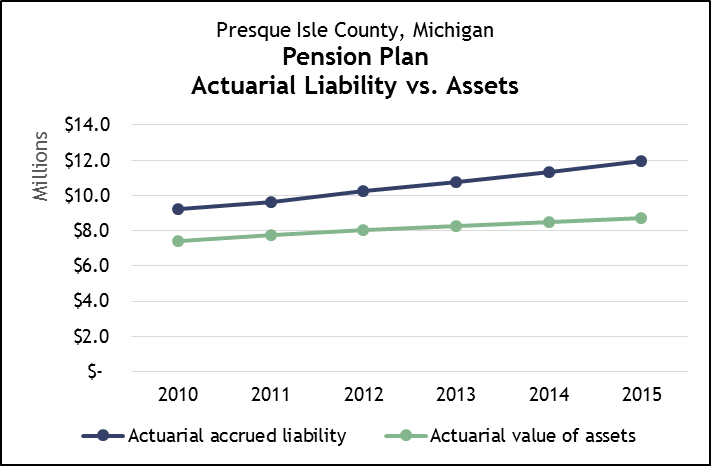
Actuarial
Assets v.
Liabilities
2010-2015
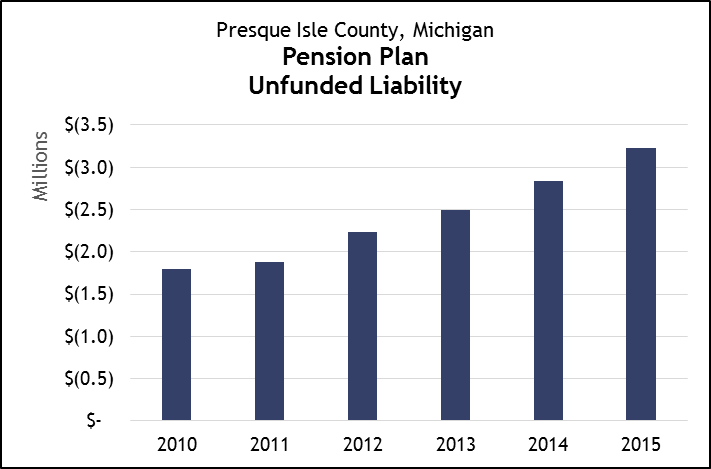
Unfunded
Liability
2010-2015
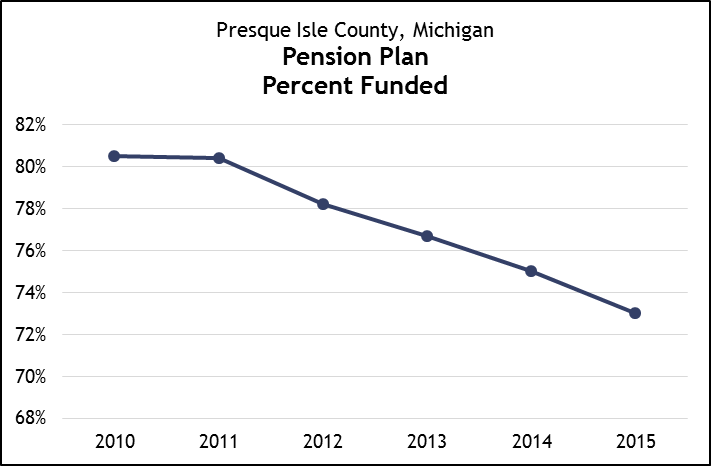
Percentage
Funded
2010-2015
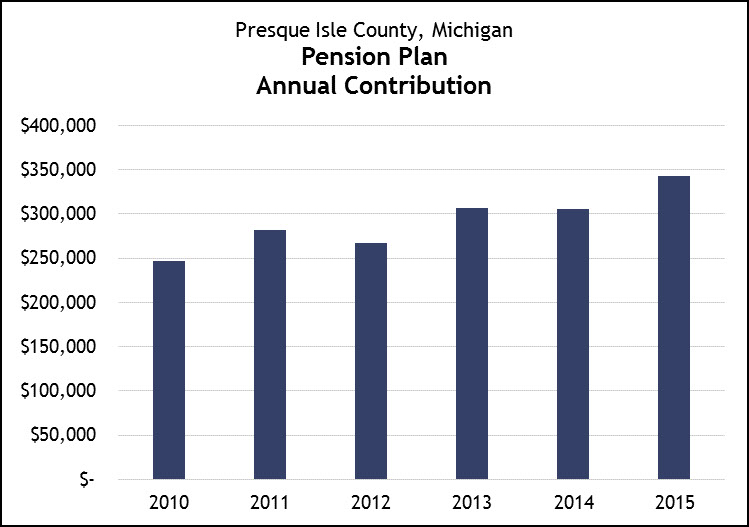
Annual
Contribution
2010-2015
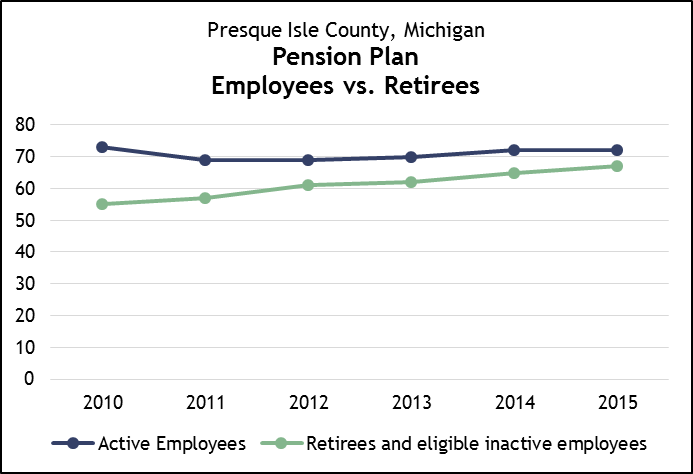
Employee to
Retiree
Comparison
2010-2015
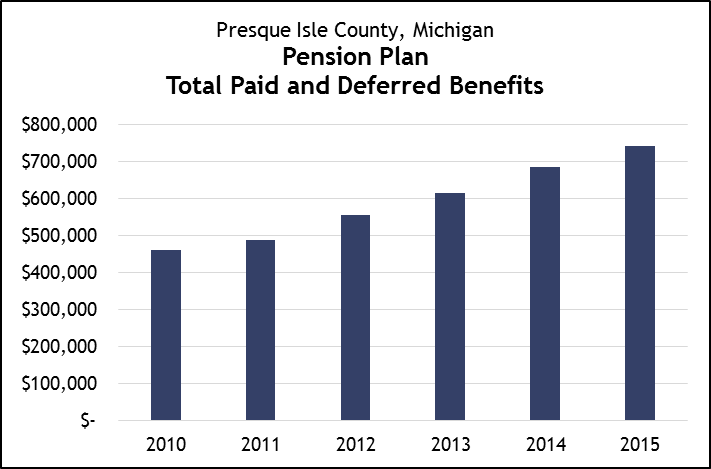
Benefit
Payouts
2010-2015
| Pension Plan Actuarial Valuations as of Decemeber 31, |
2014 | 2015 | % Change | Trend |
|---|---|---|---|---|
Value of assets |
$ 8,506,943 |
$ 8,711,218 |
2.4% |
 |
Accrued liability |
11,347,158 |
11,935,524 |
5.2% |
 |
Overfunded (underfunded) |
$ (2,840,215) |
$ (3,224,306) |
13.5% |
|
Percent funded |
75.0% |
73.0% |
- 2.7% |
 |
Unfunded liability as a percent of General Fund revenues |
56.88% |
61.2% |
7.6% |
|
Annual county contribution |
$ 305,065 |
$ 343,230 |
12.5% |
 |
Active employees |
72 |
72 |
- 0 - |
 |
Retirees and eligible inactive employees |
65 |
67 |
3.1% |
|
Ratio of employees to retirees (inc. eligible non-actives) |
1.11 |
1.07 |
- 3.6% |
|
Active employee salary |
$ 2,302,053 |
$ 2,319,824 |
0.8% |
|
Benefits paid (inc. deferred benefits) |
$ 684,987 |
$ 742,102 |
8.3% |
|
Prepared by MGT of America Consulting, LLC
Great Lakes Region
2343 Delta Road
Bay City MI, 48706