Accountability and Transparency in Government
Citizen's Guide to Finances: Expenditure Trends
Expenditures
Overview
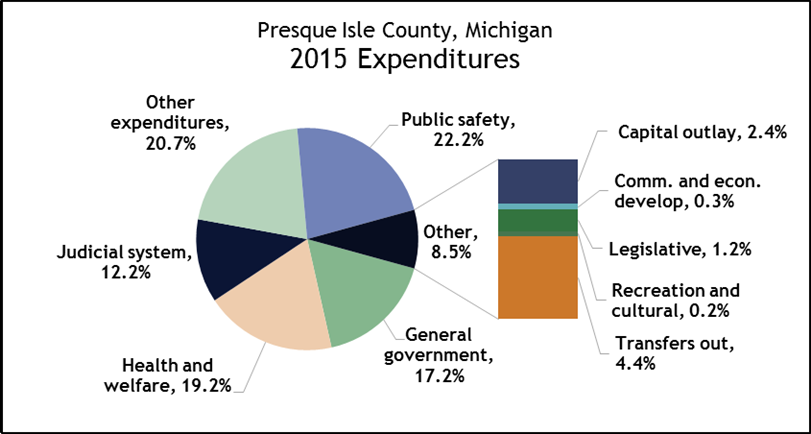
Current Year
Expenditures
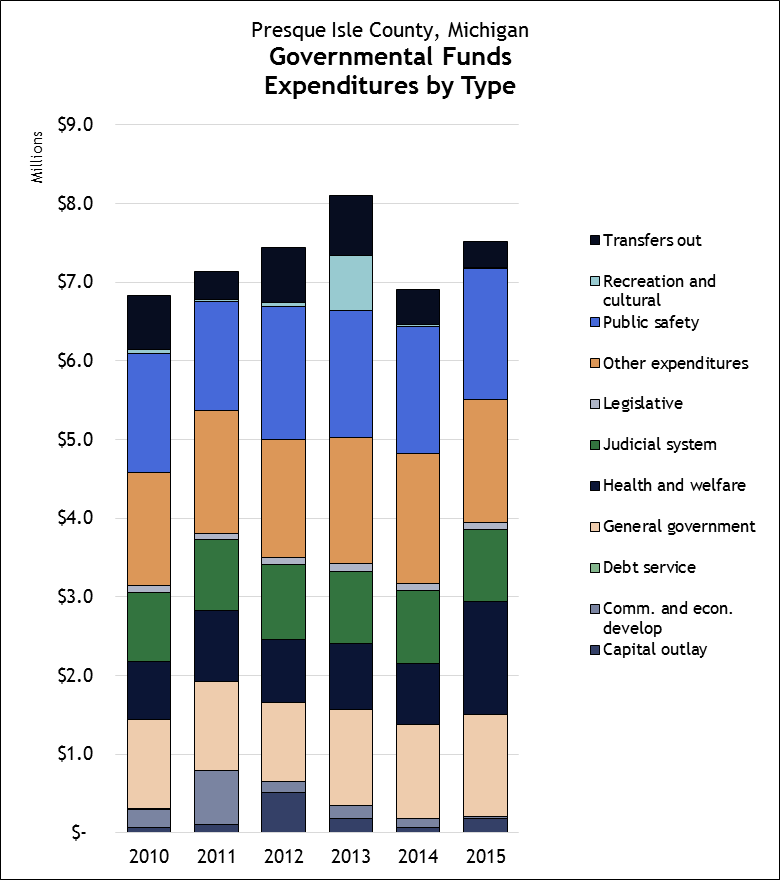
Total Expenses
by Type
2010-2015
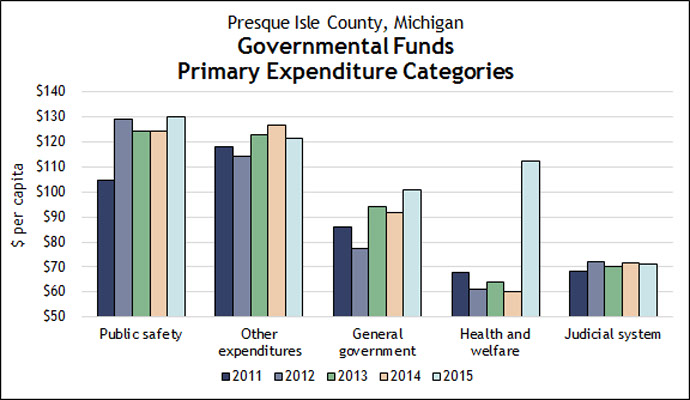
Primary Expenditures
per Capita
2010-2015
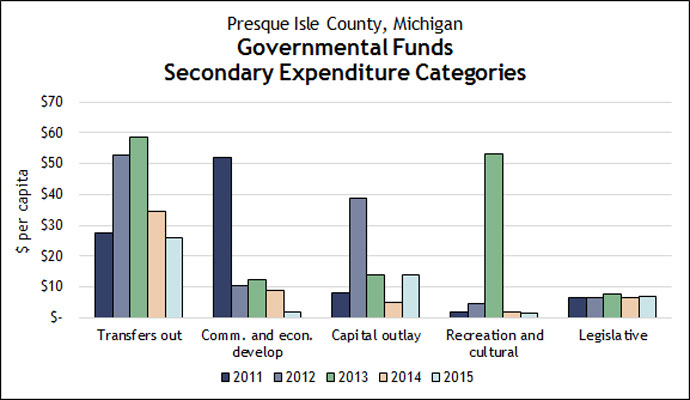
Other Expenditures
per Capita
2010-2015
| Expenditures | 2014 | 2015 | % Change | 2014 Per Capita |
2015 Per Capita |
% Change |
|---|---|---|---|---|---|---|
Legislative |
$ 85,604 |
$ 88,850 |
3.8% |
$ 6.59 |
$ 6.92 |
5.0% |
Judicial |
923,866 |
914,808 |
- 1.9% |
71.81 |
71.24 |
- 0.8% |
General government |
1,191,783 |
1,295,292 |
8.7% |
91.75 |
100.87 |
9.9% |
Public safety |
1,614,771 |
1,667,886 |
3.3% |
124.32 |
129.89 |
4.5% |
Health and welfare |
781,352 |
1,445,108 |
84.9% |
60.15 |
112.54 |
87.1% |
Community / Econonomic develop |
113,718 |
22,474 |
- 80.2% |
8.75 |
1.75 |
- 80.0% |
Recreation and culture |
23,595 |
17,970 |
- 23.8% |
1.82 |
1.40 |
- 23.0% |
Capital outlay |
65,925 |
179,419 |
172.2% |
5.08 |
13.97 |
175.3% |
Other expenditures |
1,647,113 |
1,556,650 |
- 5.5% |
126.81 |
121.22 |
- 4.4% |
Transfers out |
450,849 |
331,840 |
- 26.4% |
34.71 |
25.84 |
- 25.6% |
Total Expenditures |
$ 6,907,579 |
$ 7,520,297 |
8.9% |
$ 531.80 |
$ 585.65 |
10.1% |
Prepared by MGT of America Consulting, LLC
Great Lakes Region
2343 Delta Road
Bay City MI, 48706