
Accountability and Transparency in Government
Performance Dashboard: Economic Strength
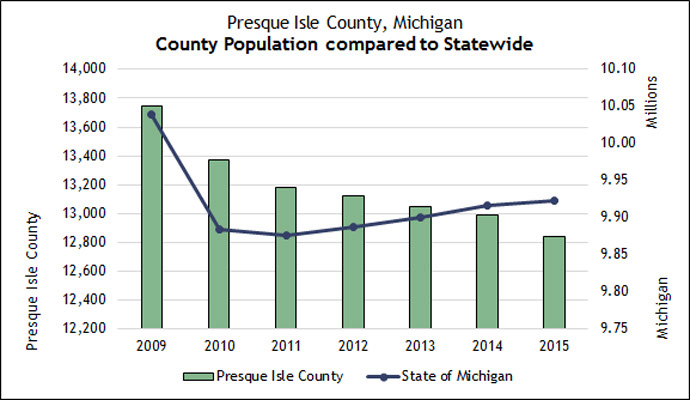
Economic Strength
2 year comparison
Population Growth
2010 - 2015
Age Distribution
2010-2015
Click here to see 5 year trend graphs for
| Economic Strength Indicators | 2013 | 2014 | 2015 | % Change | Trend |
|---|---|---|---|---|---|
Michigan state population |
9,900,506 |
9,916,306 |
9,922,576 |
0.06% |
 |
Presque Isle county population |
13,050 |
12,989 |
12,841 |
- 1.1% |
 |
Percent under age 5 |
3.6% |
3.6% |
3.6% |
- 0 - |
 |
Percent 5 to 17 years old |
13.6% |
13.2% |
12.6% |
- 4.5% |
|
Percent 18 to 64 years old |
55.7% |
55.5% |
54.2% |
- 2.3% |
|
Percent age 65 and over |
27.1% |
27.7% |
29.6% |
6.9% |
 |
Economic Indicators |
|||||
Median household income |
$ 39,652 |
$ 40,404 |
1.9% |
|
|
Per capita income |
$ 22,788 |
$ 22,938 |
0.7% |
|
|
Unemployment rate |
14.6% |
14.4% |
- 1.4% |
 |
|
Percent of population living below poverty |
12.9% |
13.7% |
6.2% |
|
|
Education Statistics |
|||||
Percent of population over 25, Bachelor's degree or higher |
16.3% |
16.4% |
0.6% |
|
|
Percent of population over 25, High school graduate |
86.8% |
87.3% |
0.6% |
|
Favorable, Positive Change
Unfavorable, Negative Change
Favorable, Negative Change
Unfavorable, Positive Change
Neutral (+/- <1%) Change
Neutral, Positive Change
Neutral, Negative Change

Prepared by MGT of America Consulting, LLC
Great Lakes Region
2343 Delta Road
Bay City MI, 48706